The results have been processed and the best predictions of the contest have been selected based on our scoring system. At the end of this page you will find the best predictions of the contest. We would like congratulate the winners and thank all the contestants for the effort to submit their prediction.
Specimen S10H1A
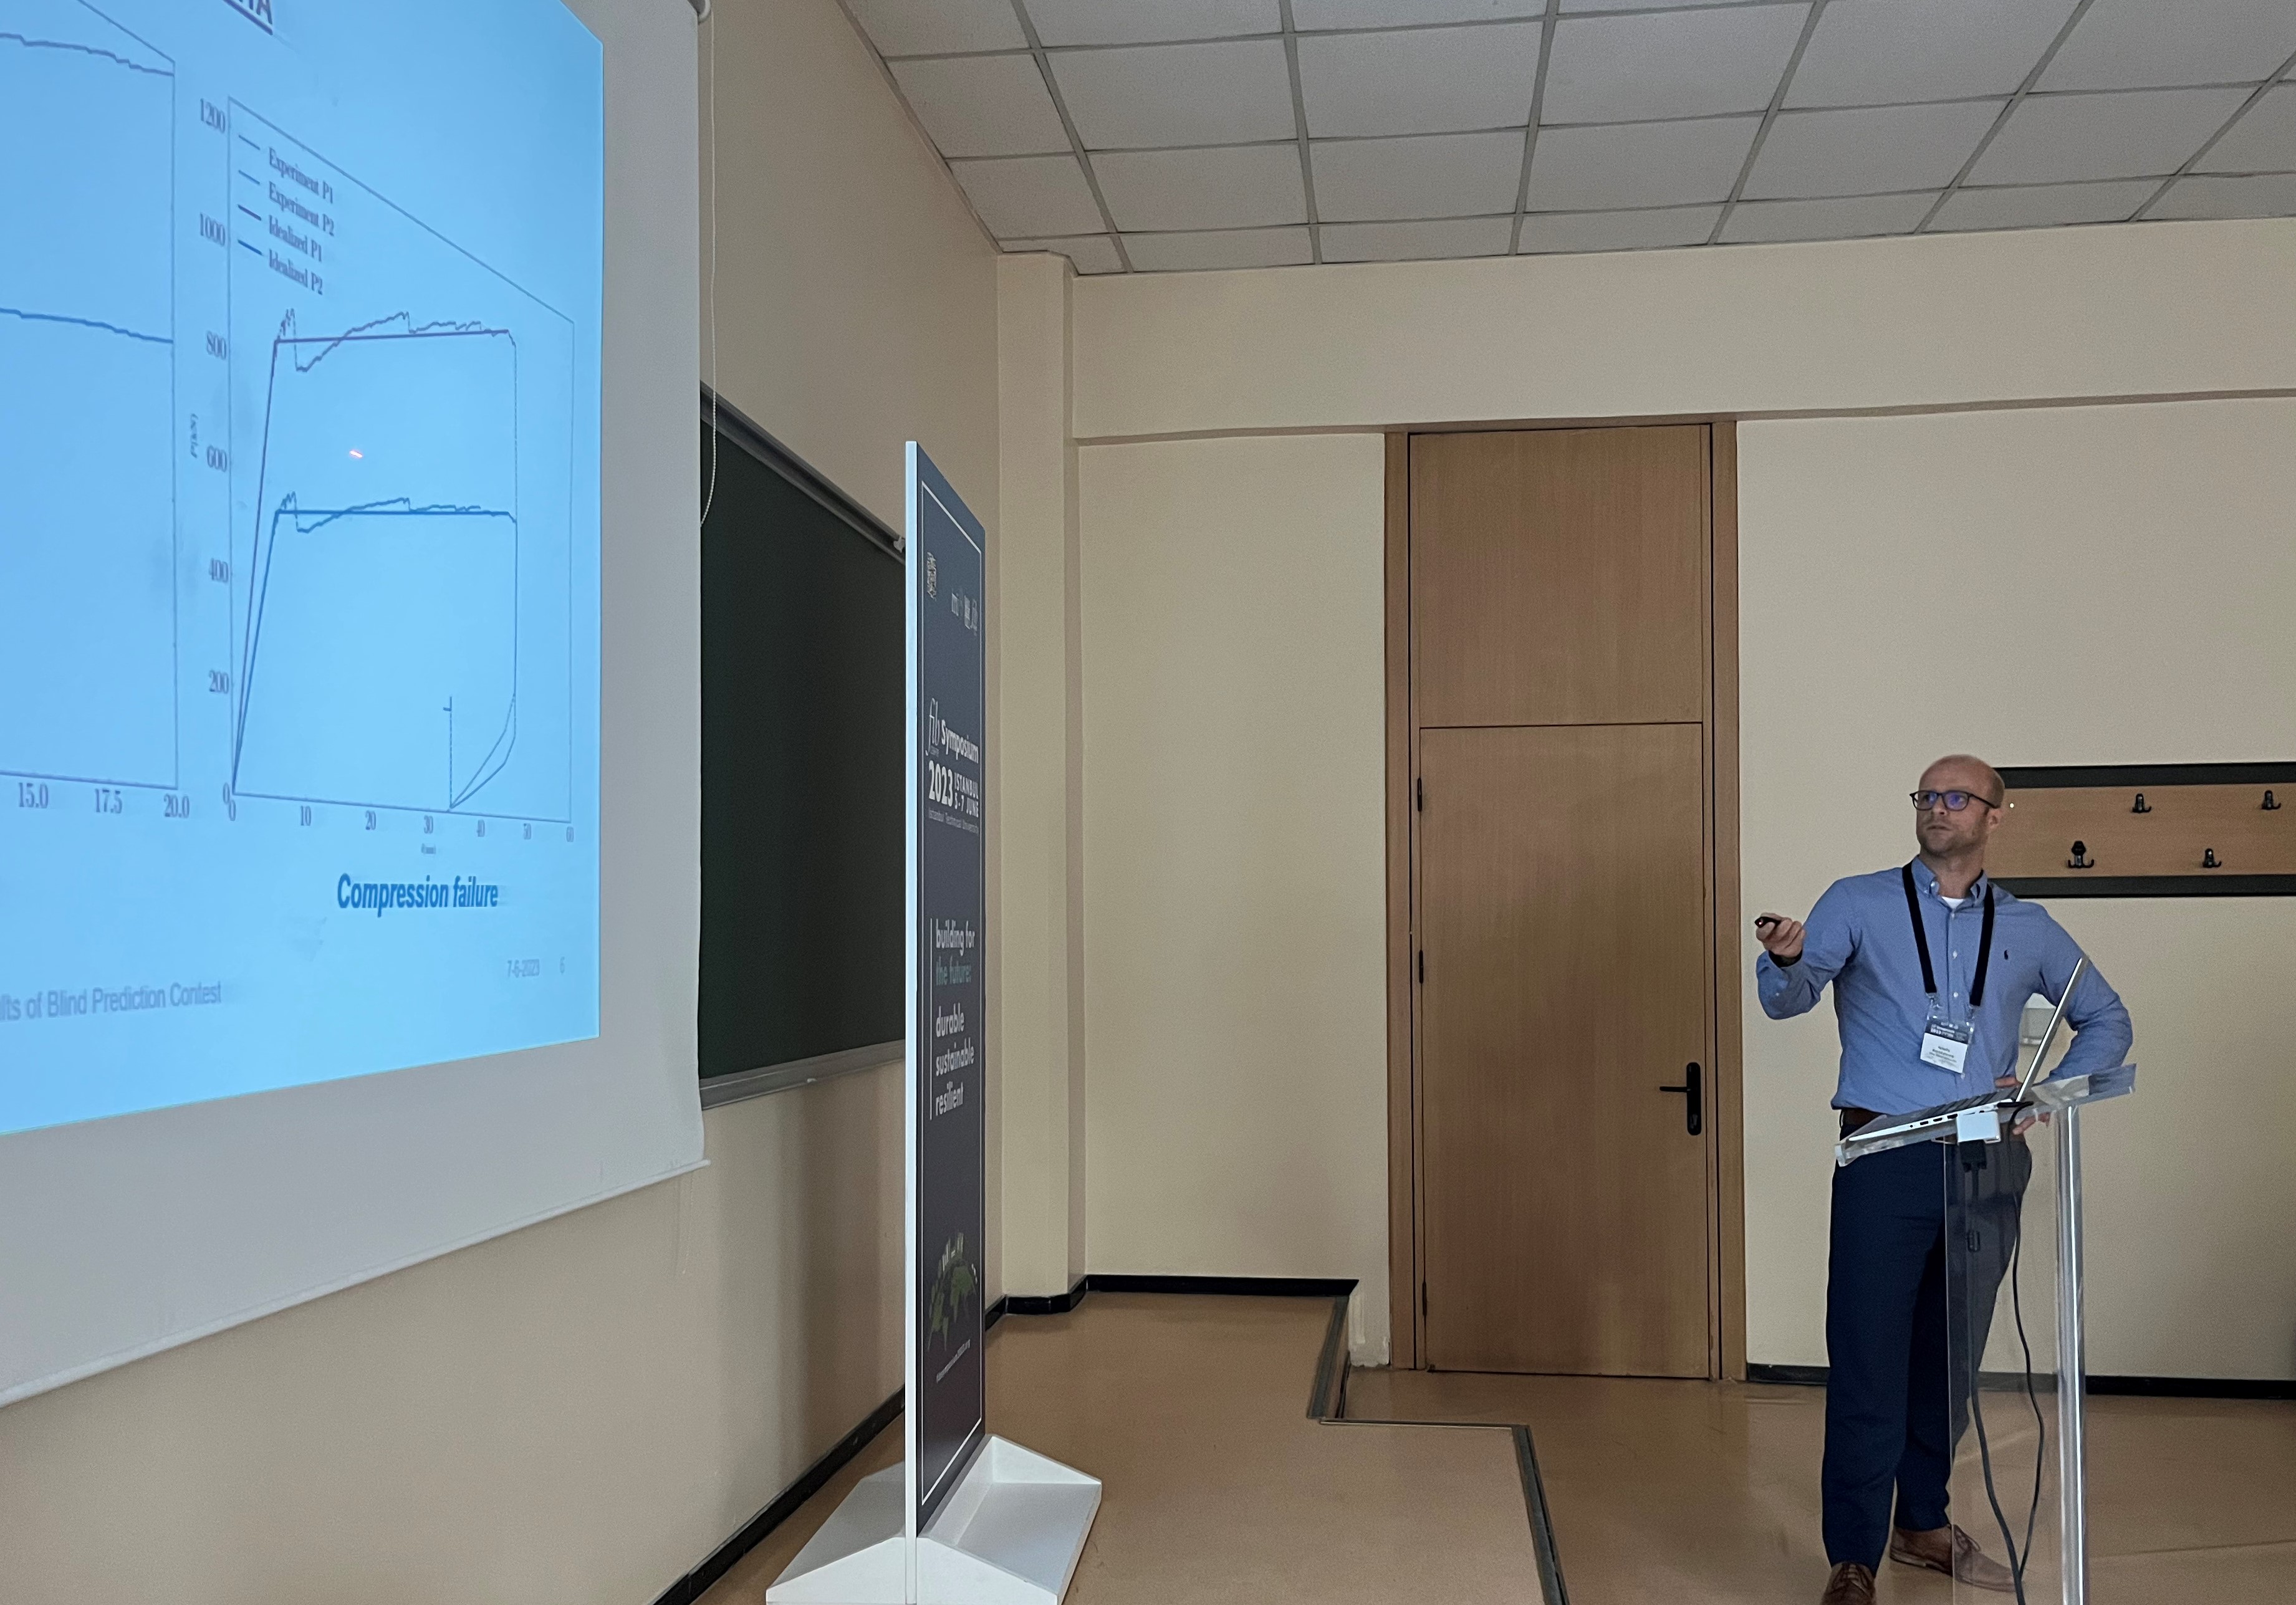
The experimental results of the first test specimen show a load-deflection cruve in which two peak values of the ultimate load can be distinguished. After the first peak load, a significant drop is observed due to loss of composite action of the beam initiated by cracking of the interface. From a structural perspective, the structural integrity is compromised. Nevertheless, the experiment is still able to proceed with increasing load values. The beam eventually fails due to crushing in the upper part of the web under P1, which is the second peak load.
Due to the presence of two peaks in the load-deflection curve with associated failure modes, no unambiguous statement can be made regarding the adopted values for scoring. For this reason, both peak loads with corresponding failure modes are taken into account in the scoring of the submissions. The method for scoring is further explained below.
Failure modes associated with the first peak:
- Loss of composite action due to cracking of interface (primary failure mode)
- Crush of concrete under P1 in the upper part of the web (secondary failure mode)
Failure modes associated with the second peak:
- Crush of concrete under P1 in the upper part of the web (primary failure mode)
- Loss of composite action due to cracking of interface (secondary failure mode)
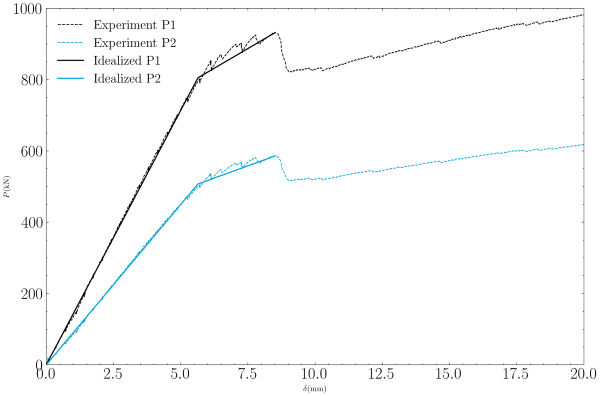
Figure 1: Idealized load-deflection curve for interface failure of specimen S10H1A
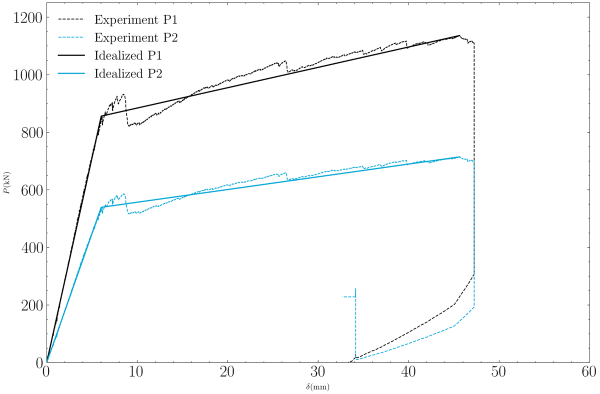
Figure 2: Idealized load-deflection curve for compression failure of specimen S10H1A
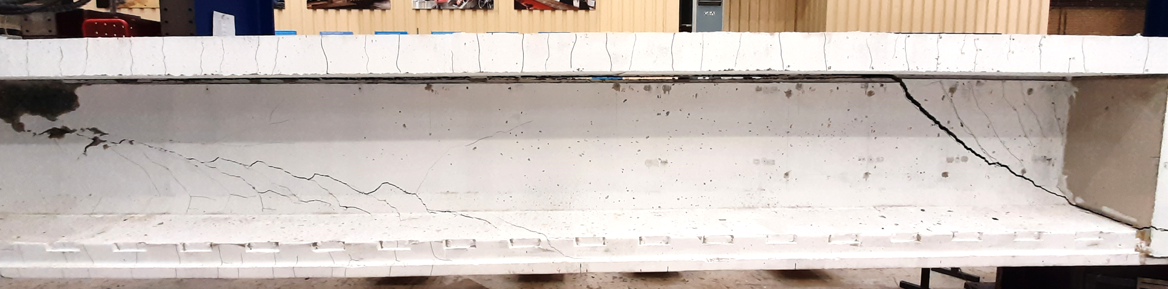
Figure 3: Post-experiment image of specimen S10H1A
Specimen S10H2D
In the load-deflection curve of specimen S10H2D shows a clear ultimate load values. The failure mode observed in this case is defined as loss of composite action due to cracking of interface.
Failure modes associated with the peak load:
- Loss of composite action due to cracking of interface (primary failure mode)
- Unstable opening of (an) inclined crack(s) in the web approaching the intermediate support (secondary failure mode)
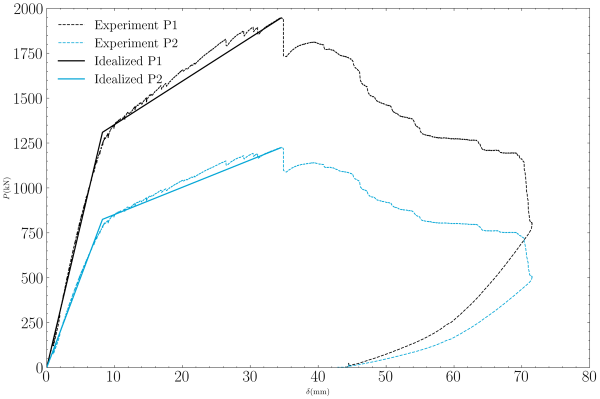
Figure 4: Idealized load-deflection curve for interface failure of specimen S10H2D
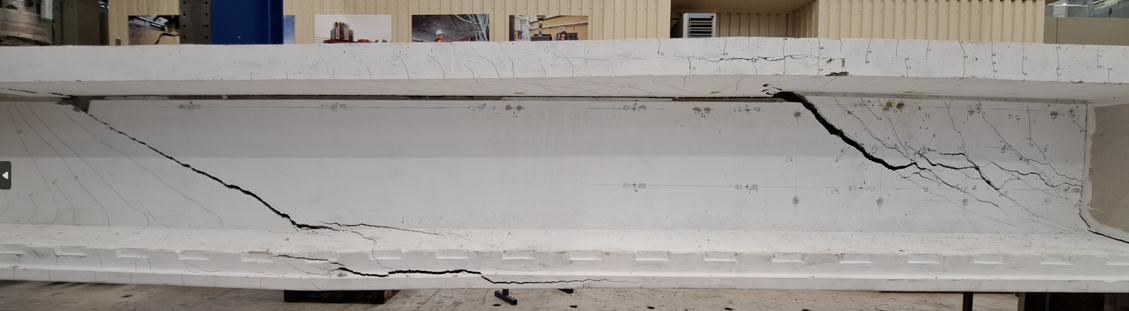
Figure 5: Post-experiment image of specimen S10H2D
Scoring card values
Table 1: Overview of experimental values
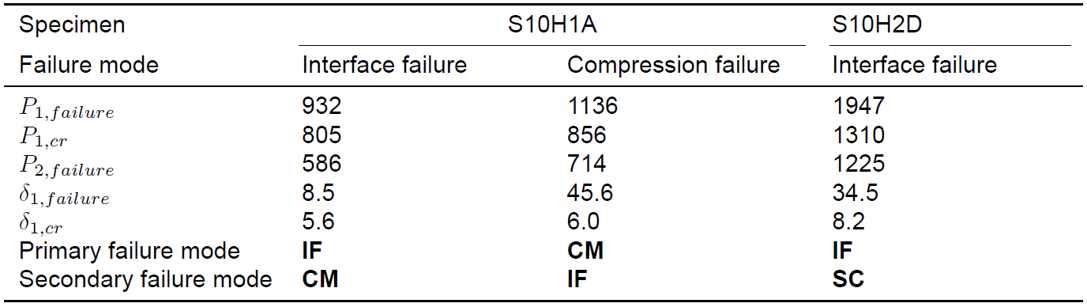
As previously mentioned, specimen S10H1A shows two peak values in the load-deflection diagram, which correspond with different failure modes. At the level of the first peak load the structural integrity is lost, which is why this ultimate load values is classified as the reference value. In table 1 these values can be found in the column S10H1A Interface failure. The method for scoring is taken as initinal scoring system, further refered to as method A. The second peak value is however also taken into account by the introduction of an additional scoring method B. For this scoring the maximum scoring values of S10H1A Interface failure and S10H1A Compression failure is taken into account.
Points Method A: S10H1A Interface failure + S10H2D Interface failure
Points Method B: max(S10H1A Interface failure, S10H1A Compression failure) + S10H2D Interface failure
Important note: After evaluation of the scoring methods it is observed that the points acquired in top 3 predictions are identical for scoring method A and B.
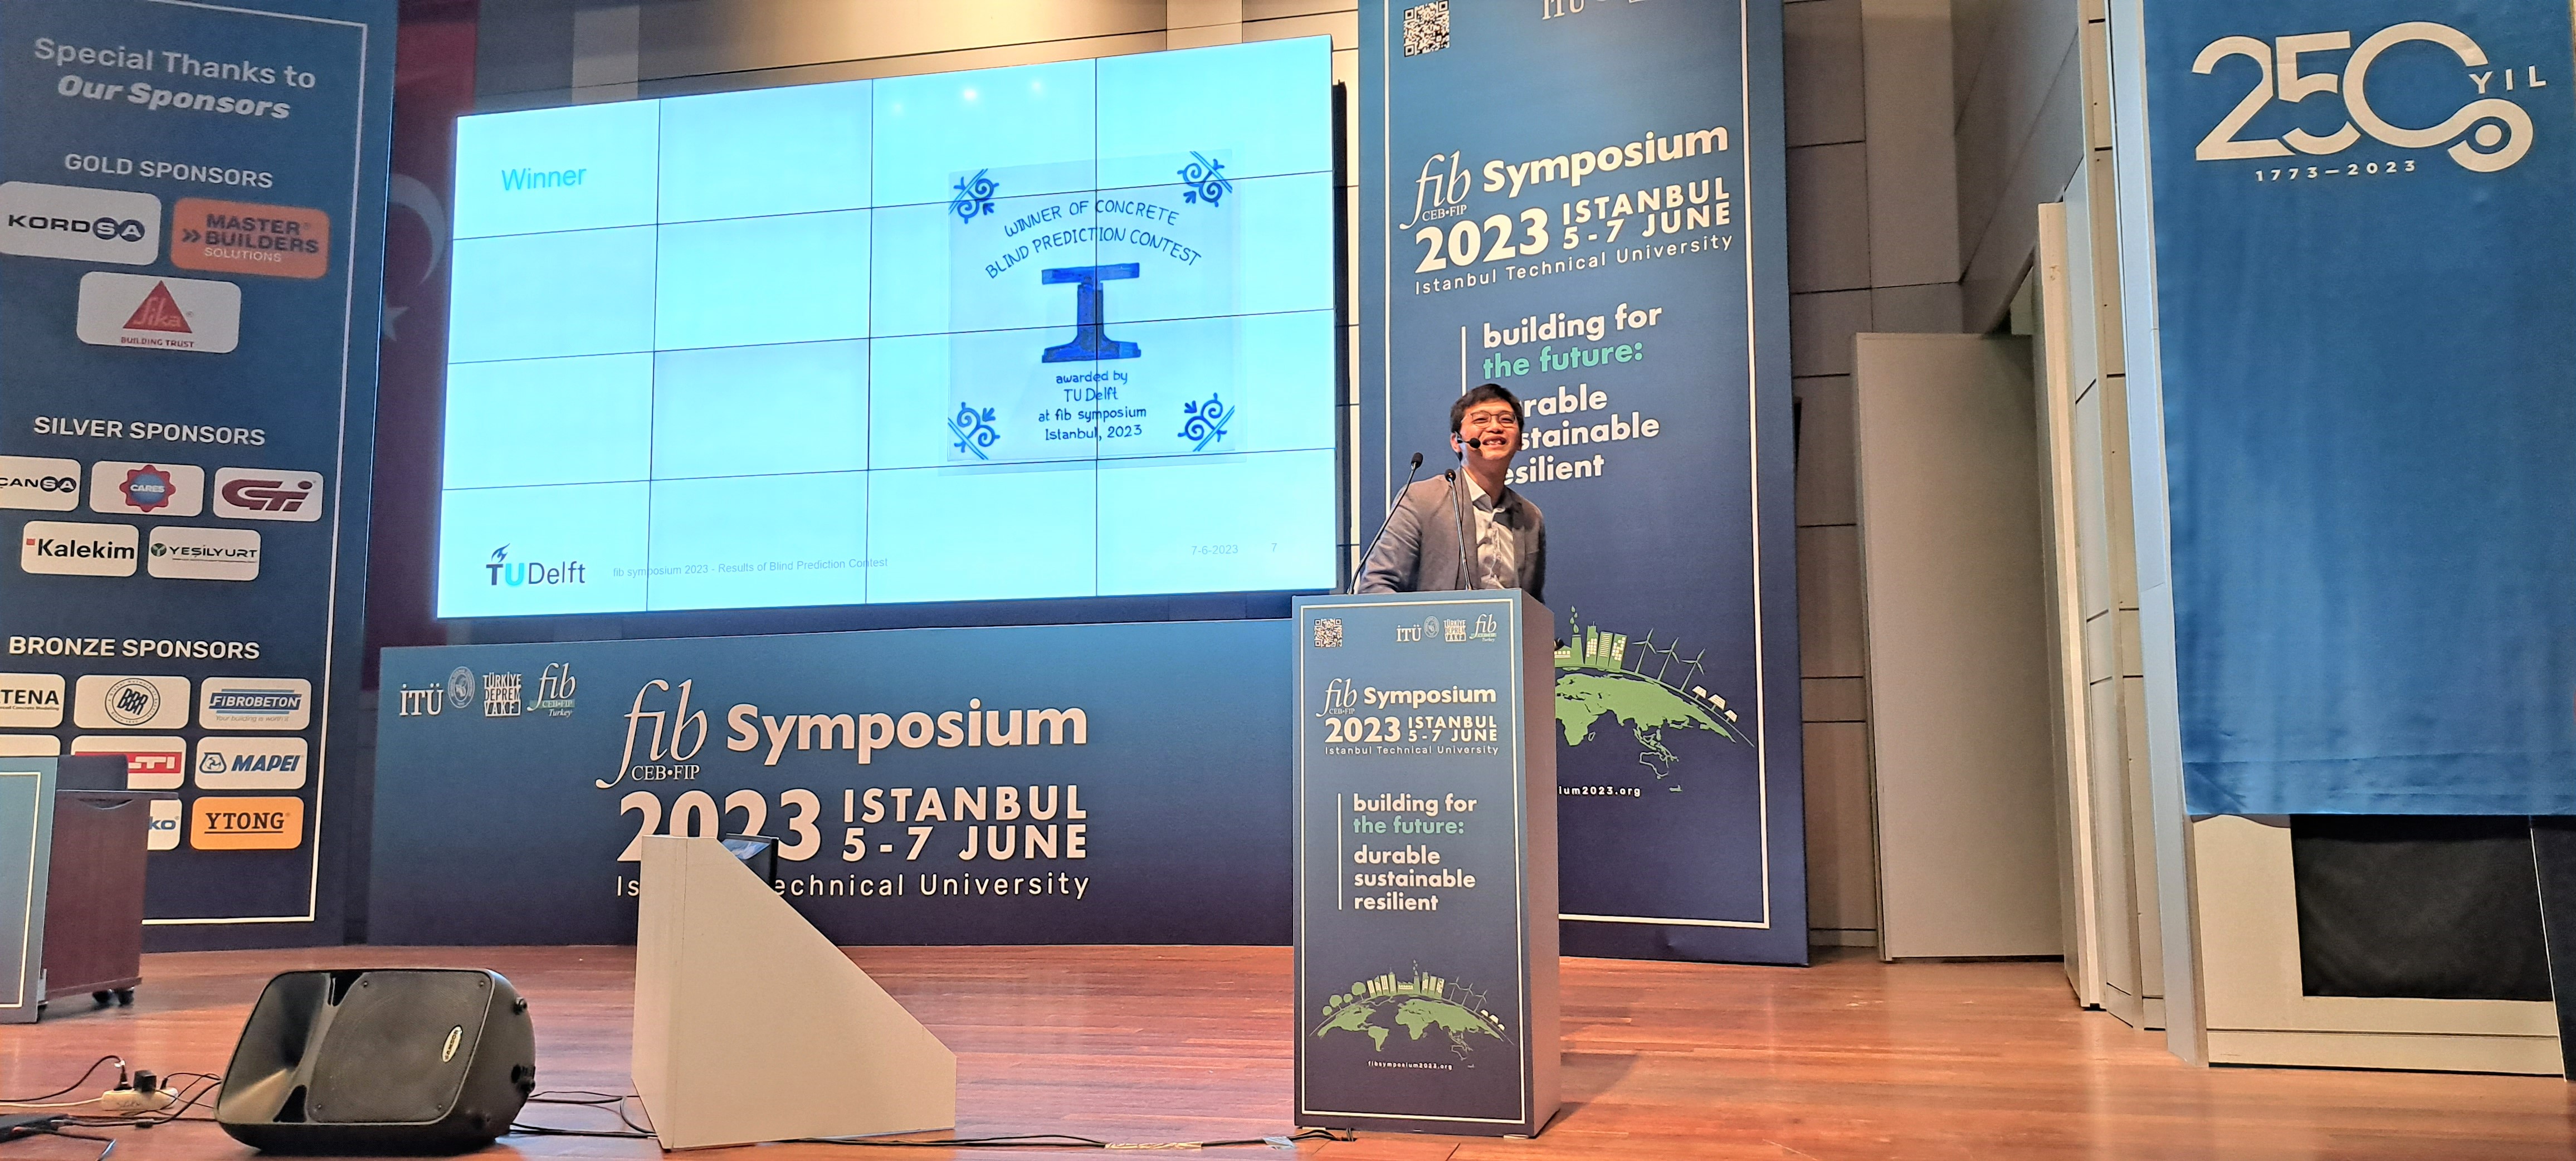
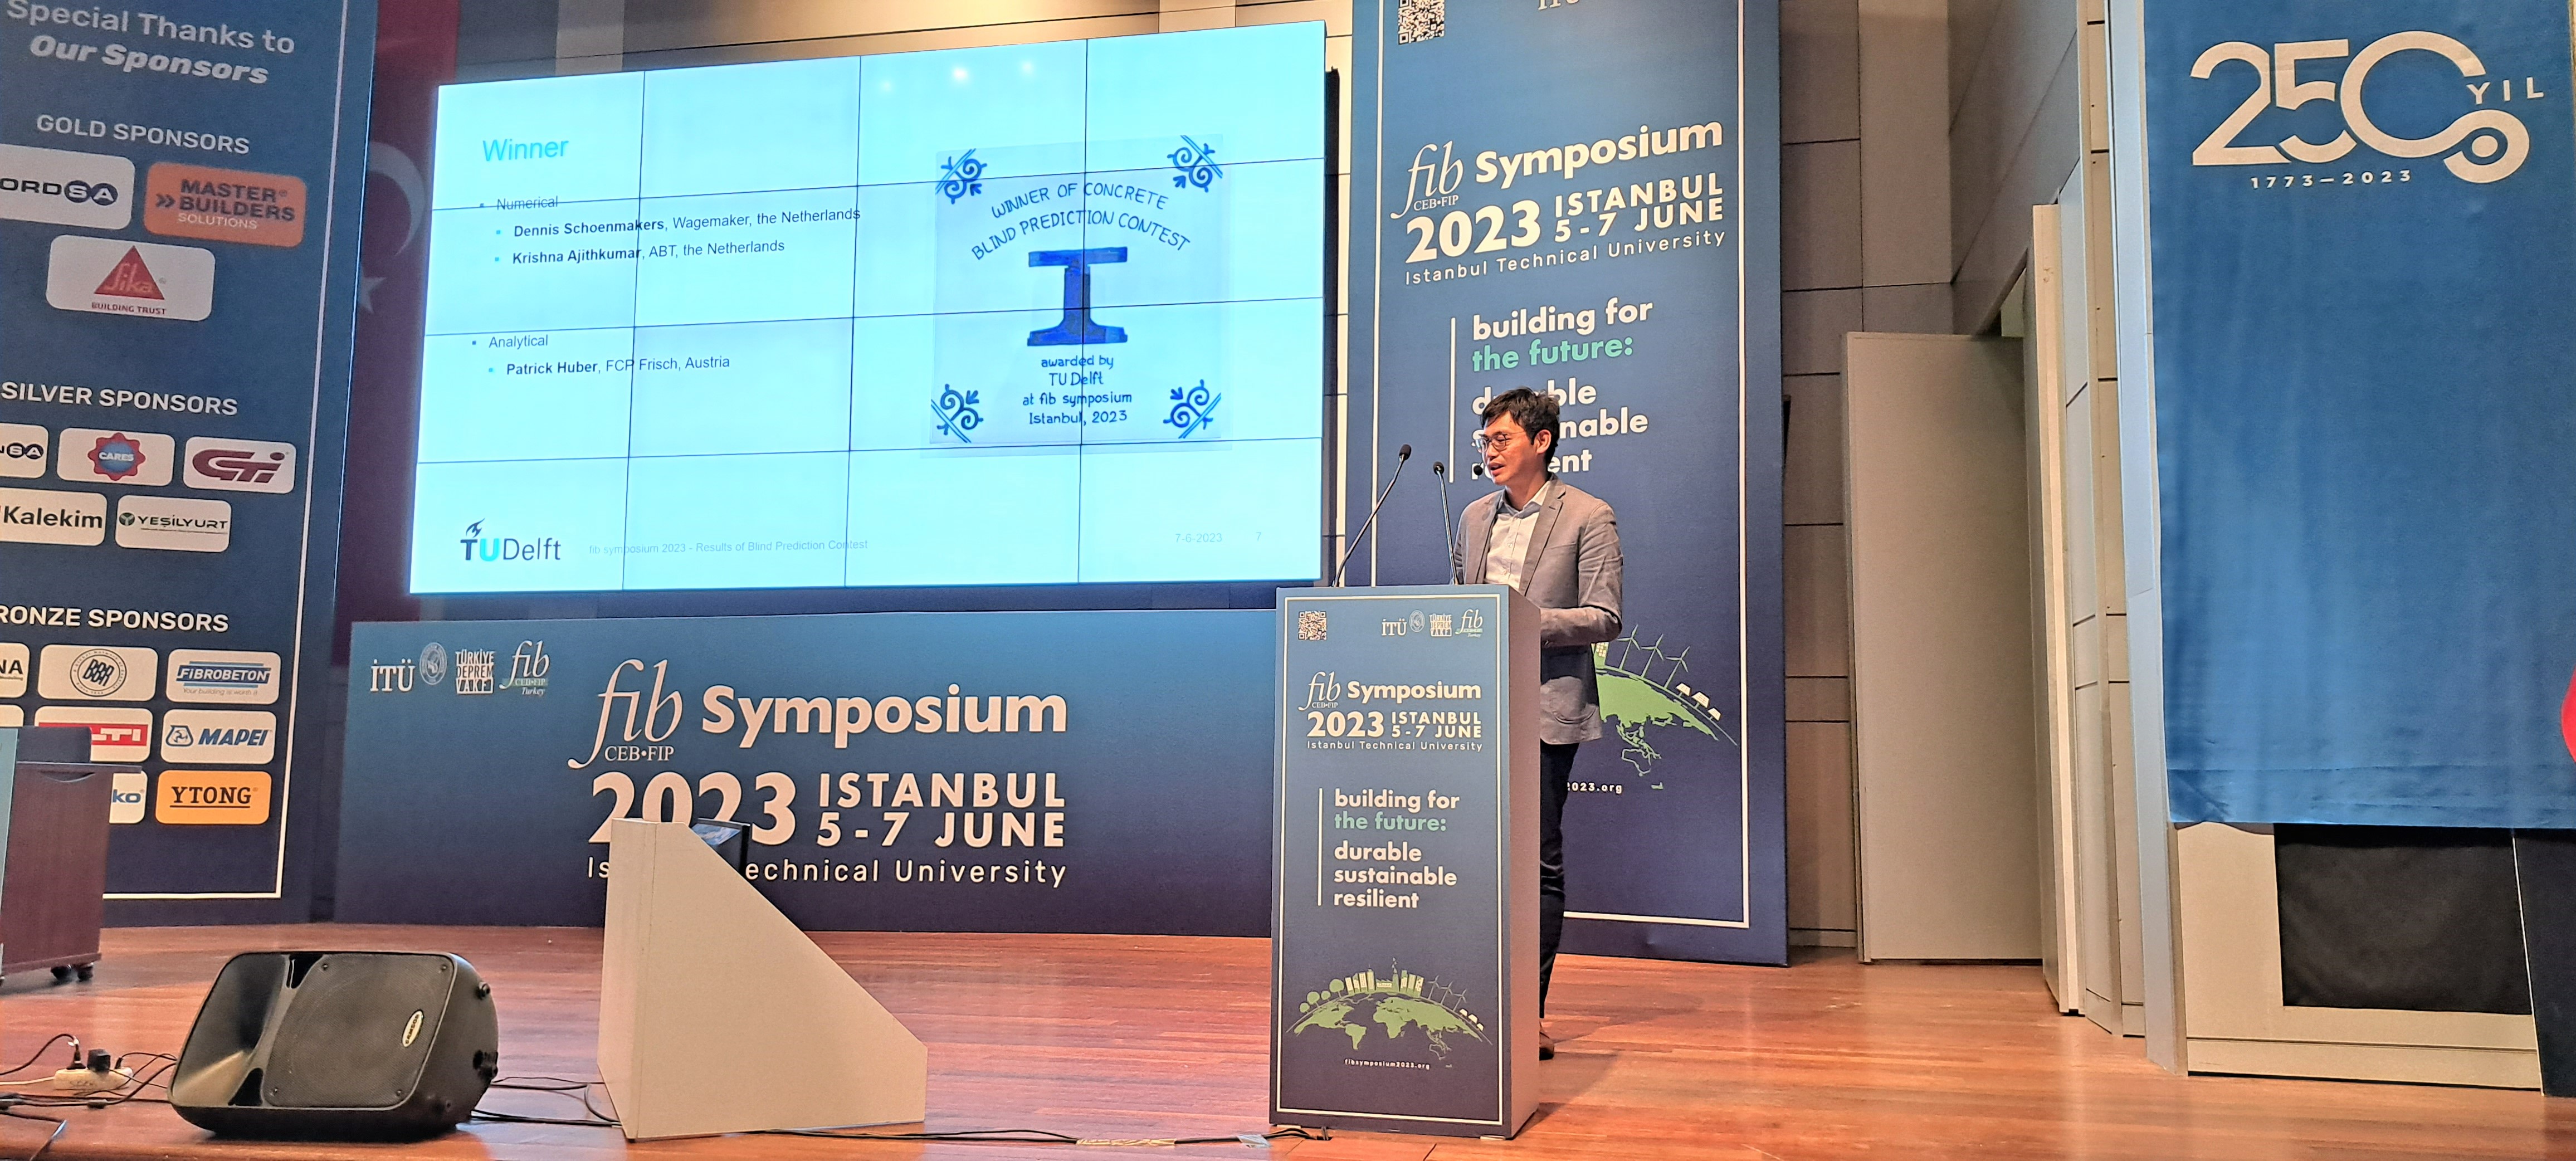
Winners of the contest
Numerical predictions
Based on our scoring system, we have selected two winners for the numerical predictions since these scores were too close to call.
- Dennis Schoenmakers, Wagenmaker, The Netherlands
- K. Ajithkumar Pillai & S. Bindiganavile Ramadas, ABT, The Netherlands
Analytical predictions
- Patrick Huber & Iztok Arnuga & Tobias Huber, FCP Fritsch, Chiari & Partner ZT, FH Campus Wien, TU Wien, Austria
Acknowledgement
Once again we would like to express our sincere appreciation to everyone who participated in this blind prediction competition. Special congratulations to the winners of the competition, as predicting the structural behavior of such experiments has turned out to be challenging. Performing these blind predictions will allow us to evaluate the state of the art analysis and help us all move forward. Finally, we would also like to thank Ricky Tai, Jan Cervenka and Evan Bentz for their contribution in the special session at the fib symposium 2023 in Istanbul.